

What is Data Visualization? Data visualization is the concept of communicating information through visual aids, like charts and graphs. Communicating data in a visual manner makes it easier to spot patterns, trends, and correlations that can simply go unnoticed in traditional reports and spreadsheets.
A successful data visualization starts with a solid concept that is used to communicate some sort of information to an audience. All of the elements within the data visualization from the chart types to color choices need to be functional and support that initial concept to effectively serve their purpose. If everything is in order, data visualization can be an effective tool for getting the right data to the right people at the right time.
Benefits of Using Data Visualization
If you are used to a certain way of reporting, we understand that you may be hesitant to start using data visualization. While it can be hard to rip off the band-aid, there are many advantages to trying out something new.
Here are just 5 key benefits of using data visualization:
1. Saves Time
Data visualization makes it much easier to spot trends and patterns in your data so can immediately see the key takeaways. With traditional reports, you may spend hours sifting through spreadsheets and tables, and still walk away with no actionable insight. Digital data visualizations like dashboards are automatically updated or updated at controlled intervals, saving you time that you used to spend on creating new reports that would immediately become outdated.
2. Increases Understanding
Without visualization, data may seem like a confusing jumble of statistics, formulas, and numbers to some of your employees. This can be a big problem in a startup or small business where it is crucial that everyone be on the same page. Data visualization helps even the most data adverse people be able to use and understand it.
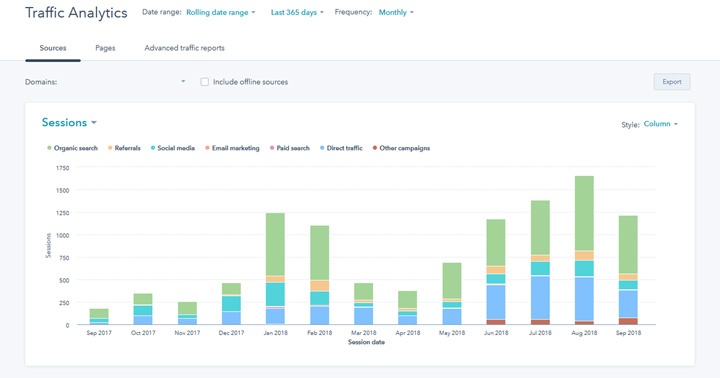 Example of visual data chart illustrates 9 points of data (7 traffic sources + volume+ time) for one year
3. Creates a Culture of Transparency
When dashboards are made public, everyone in the organization can see areas that are performing well and where they can make improvements. When all of your employees begin to understand your target metrics, they are able to generate better ideas, test solutions, and solve issues. Not to mention, a culture of transparency promotes open communication, which can have a big impact on employee retention, productivity, and engagement.
4. Drives Action
Data on its own doesn’t reveal any actionable insight, and it can be difficult and time-consuming to figure out the main takeaway. An effective data visualization will highlight critical information that influences business decisions. When you aren’t getting lost in a sea of data, it is much easier to gain those key insights and start acting on them right away.
5. Encourages Engagement
Traditional reports and spreadsheets are static and un-engaging, and often take so long to complete that the information they contain is outdated by the time it’s shared. This leads to many people simply ignoring these reports, especially if they have a hard time finding any actionable insights from the information presented.
Data visualization is much more engaging because you can interact with the data and customize the design to fit your company’s specific needs. Plus, with the right software, digital reporting updates automatically so the insights are timely and relevant.
What Makes Data Visualization So Effective?
In a word: psychology.
Data visualization speaks to our brains differently than numbers, and communicates on a higher level and with greater impact. By understanding cognitive psychology and the effect that visual aids have on our brains, it is easy to see how data visualization leads to enhanced decision-making and a deeper understanding of data.
To start, our brains are able to process visual information much faster than numbers on a spreadsheet. Data visualization turns seemingly random number sets into aesthetically pleasing visuals with that all-important context our brains crave. You can tell a narrative with your data and integrate already learned information for quicker and more concrete connections. This connects your long and short-term memory to help you more permanently remember the information. In fact, studies of visual communication show that while people remember only 20% of what they read, they remember 80% of what they see.
If you truly want to capture your audience’s attention, you should consider creating an interactive or animated data visualization. Human naturally associate quick movements with action. When data flashes as you hover over a correlating element in a dashboard, your attention becomes focused in a way that it wouldn’t be if you were simply looking at raw data on a page. It also encourages people to learn by exploring the data for themselves and drawing their own conclusions.
Conclusion
Employing data visualization for your small business metrics can open the door to new insights, better decision making, increased trust, and faster action. If you think your reporting needs a refresher, dashboards and data visualization could be the answer!
 Our guest author, Samantha Marsh, works for iDashboards, a data visualization software company on a mission to transform traditional reporting into meaningful dashboards.
Outside of work, she enjoys playing golf, listening to podcasts, and watching Michigan football.


Leave a comment